Archive
Champions | ArtworkPlayers
Leading Scorers | Highest Average | Games PlayedTeams
Championships | Wins | Win Percentage | PointsArchive
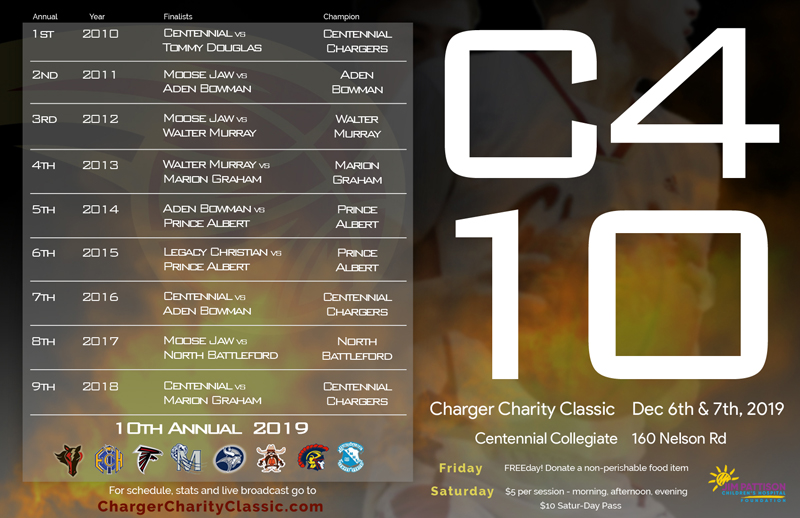
Past Champions
2019 Champions


2018 Champions


2017 Champions


2016 Champions


2015 Champions


2014 Champions


2013 Champions


2012 Champions


2011 Champions


2010 Champions


Artwork


Players
Tournament Overall Leading Scorers
| Place | Player | Points | Games | Average |
|---|---|---|---|---|
| 1st |  Simon Engen Simon EngenEvan Hardy Souls 2017, 2018, 2019 | 211 | 8 | 26.38 |
| 2nd |  Ben Gaskin Ben GaskinMarion Graham Falcons 2018, 2019 | 147 | 6 | 24.50 |
| 3rd |  Keon Cleland Keon ClelandCentennial Chargers 2017, 2018, 2019 | 143 | 9 | 15.89 |
| 4th |  Connor Murray Connor MurrayPrince Albert St. Mary High School 2012, 2013, 2014, 2015 | 143 | 10 | 14.30 |
| 5th |  Jordin Rusnack Jordin RusnackYorkton Regional Raiders 2016, 2017, 2018 | 142 | 7 | 20.29 |
| 6th |  Simon Pankratz Simon PankratzTommy Douglas Tigers 2016, 2017 | 133 | 5 | 26.60 |
| 7th | Noah Bymak Yorkton Raiders 2017, 2018, 2019 | 130 | 9 | 14.44 |
| 8th |  Damon Dutton Damon DuttonNorth Battleford Vikings 2014, 2015, 2017 | 127 | 8 | 15.88 |
| 9th | Evan Parchomchuk Prince Albert St. Mary High School 2012, 2013, 2014, 2015 | 123 | 11 | 11.18 |
| 10th | Daniel Mandziuk Yorkton Regional Raiders 2010, 2010, 2011, 2012 | 120 | 9 | 13.33 |
| 11th |  Levi Beaudry Levi BeaudryLegacy Christian Academy 2014, 2015 | 115 | 6 | 19.17 |
| 12th | Nick Johnson Centennial Chargers 2016, 2017, 2018 | 105 | 8 | 13.13 |
| 13th | Matthew Bryant Centennial Chargers 2017, 2018 | 98 | 6 | 16.33 |
| 14th |  Tiegen Derksen Tiegen DerksenAden Bowman Bears 2014, 2015 | 97 | 6 | 16.17 |
| 15th | Ben Redl Yorkton Regional Raiders 2010, 2011, 2012 | 94 | 9 | 10.44 |
| 16th | Dan Reynolds Legacy Christian Academy 2014, 2015 | 92 | 6 | 15.33 |
| 17th | Lucas Derksen Aden Bowman Bears 2010, 2011 | 86 | 6 | 14.33 |
| 18th | Arthur Schuler Aden Bowman Bears 2014, 2015, 2016 | 83 | 9 | 9.22 |
| 19th | Brolin Simes Evan Hardy Souls 2016, 2017 | 82 | 5 | 16.40 |
| 20th |  Reid Thuringer Reid ThuringerChristian Centre Academy 2011 | 81 | 3 | 27.00 |
Tournament Overall Highest Average
| Place | Player | Average | Points | Games |
|---|---|---|---|---|
| 1st | Evan Halyk Prince Albert St. Mary High School 2011 | 33.00 | 66 | 2 |
| 2nd | Reid Thuringer Christian Centre Academy 2011 | 27.00 | 81 | 3 |
| 3rd |  Brandon Ritzand Brandon RitzandBedford Road Redmen 2010 | 26.67 | 80 | 3 |
| 4th |  Chris Fryett-Miller Chris Fryett-MillerWalter Murray Marauders 2012 | 26.67 | 80 | 3 |
| 5th | Simon Pankratz Tommy Douglas Tigers 2016, 2017 | 26.60 | 133 | 5 |
| 6th | Simon Engen Evan Hardy Souls 2017, 2018, 2019 | 26.38 | 211 | 8 |
| 7th | Ben Gaskin Marion Graham Falcons 2018, 2019 | 24.50 | 147 | 6 |
| 8th | Ryan Schmidt Centennial Chargers 2010 | 24.00 | 72 | 3 |
| 9th | Micah Pankratz Tommy Douglas Tigers 2017 | 23.00 | 23 | 1 |
| 10th | Brandon Tolentino Prince Albert St. Mary High School 2015 | 22.67 | 68 | 3 |
| 11th | Cody Buziak North Battleford Composite Vikings 2010 | 21.33 | 64 | 3 |
| 12th | Jordin Rusnack Yorkton Regional Raiders 2016, 2017, 2018 | 20.29 | 142 | 7 |
| 13th | Addison Dewar Marion Graham Falcons 2013 | 19.67 | 59 | 3 |
| 14th | Conlan Bear North Battleford Vikings 2018 | 19.50 | 39 | 2 |
| 15th | Levi Beaudry Legacy Christian Academy 2014, 2015 | 19.17 | 115 | 6 |
| 16th | Cain Witzaney North Battleford Vikings 2017 | 19.00 | 19 | 1 |
| 17th | Keaven Simes Aden Bowman Bears 2010 | 18.67 | 56 | 3 |
| 18th | Tyler Wilson North Battleford Composite Vikings 2010 | 18.33 | 55 | 3 |
| 19th |  Bryce Marcotte Bryce MarcotteMoose Jaw Central Collegiate 2011 | 18.00 | 54 | 3 |
| 20th | Brennan Dupre P.A. St. Mary Marauders 2019 | 18.00 | 36 | 2 |
Tournament Overall Games Played
| Place | Player | Games | Points | Average |
|---|---|---|---|---|
| 1st | Evan Parchomchuk Prince Albert St. Mary High School 2012, 2013, 2014, 2015 | 11 | 123 | 11.18 |
| 2nd | Cole Simon North Battleford Vikings 2012, 2013, 2014, 2015 | 11 | 77 | 7.00 |
| 3rd | Connor Murray Prince Albert St. Mary High School 2012, 2013, 2014, 2015 | 10 | 143 | 14.30 |
| 4th | Keon Cleland Centennial Chargers 2017, 2018, 2019 | 9 | 143 | 15.89 |
| 5th | Noah Bymak Yorkton Raiders 2017, 2018, 2019 | 9 | 130 | 14.44 |
| 6th | Daniel Mandziuk Yorkton Regional Raiders 2010, 2010, 2011, 2012 | 9 | 120 | 13.33 |
| 7th | Ben Redl Yorkton Regional Raiders 2010, 2011, 2012 | 9 | 94 | 10.44 |
| 8th | Arthur Schuler Aden Bowman Bears 2014, 2015, 2016 | 9 | 83 | 9.22 |
| 9th | Ethan Wandzura P.A. St. Mary Marauders 2017, 2018, 2019 | 9 | 80 | 8.89 |
| 10th | Luke Donauer Legacy Christian Academy 2014, 2015, 2016 | 9 | 68 | 7.56 |
| 11th | Tyson Black Yorkton Regional Raiders 2013, 2014, 2015 | 9 | 64 | 7.11 |
| 12th | Adam Keen Centennial Chargers 2016, 2017, 2018 | 9 | 60 | 6.67 |
| 13th | Matt Dutton North Battleford Vikings 2012, 2013, 2014, 2015 | 9 | 56 | 6.22 |
| 14th | Caleb Bymak Yorkton Regional Raiders 2013, 2014, 2015 | 9 | 40 | 4.44 |
| 15th | Simon Engen Evan Hardy Souls 2017, 2018, 2019 | 8 | 211 | 26.38 |
| 16th | Damon Dutton North Battleford Vikings 2014, 2015, 2017 | 8 | 127 | 15.88 |
| 17th | Nick Johnson Centennial Chargers 2016, 2017, 2018 | 8 | 105 | 13.13 |
| 18th | Jordan Silzer Centennial Chargers 2014, 2015, 2016 | 8 | 78 | 9.75 |
| 19th | Alex Popoff Yorkton Regional Raiders 2012, 2013, 2014 | 8 | 74 | 9.25 |
| 20th | Joel Forer Moose Jaw Central Collegiate 2013, 2014, 2015 | 8 | 38 | 4.75 |
Teams
Tournament Overall Championships
| Place | Player | Championships | Wins | Losses | Win % | Points |
|---|---|---|---|---|---|---|
| 1st | Centennial Chargers 2010, 2011, 2012, 2013, 2014, 2015, 2016, 2017, 2018, 2019 | 4 | 22 | 8 | 73.33% | 2080 |
| 2nd | Prince Albert Carlton Crusaders 2010, 2011, 2012, 2013, 2014, 2015, 2016, 2017, 2018, 2019 | 2 | 16 | 14 | 53.33% | 2020 |
| 3rd | Marion Graham Falcons 2013, 2018, 2019 | 1 | 6 | 3 | 66.67% | 647 |
| 4th | Walter Murray Marauders 2012, 2013, 2015, 2017, 2019 | 1 | 10 | 5 | 66.67% | 1012 |
| 5th | Aden Bowman Bears 2010, 2011, 2012, 2014, 2015, 2016 | 1 | 12 | 6 | 66.67% | 1193 |
| 6th | North Battleford Composite Vikings 2010, 2012, 2013, 2014, 2015, 2017, 2018, 2019 | 1 | 7 | 17 | 29.17% | 1352 |
Tournament Overall Wins
| Place | Player | Wins | Losses | Win % | Championships | Points |
|---|---|---|---|---|---|---|
| 1st | Centennial Chargers 2010, 2011, 2012, 2013, 2014, 2015, 2016, 2017, 2018, 2019 | 22 | 8 | 73.33% | 4 | 2080 |
| 2nd | Prince Albert Carlton Crusaders 2010, 2011, 2012, 2013, 2014, 2015, 2016, 2017, 2018, 2019 | 16 | 14 | 53.33% | 2 | 2020 |
| 3rd | Yorkton Regional Raiders 2010, 2011, 2012, 2013, 2014, 2015, 2016, 2017, 2018, 2019 | 13 | 17 | 43.33% | 0 | 1871 |
| 4th | Moose Jaw Central Collegiate 2011, 2012, 2013, 2014, 2015, 2016, 2017 | 12 | 9 | 57.14% | 0 | 1358 |
| 5th | Aden Bowman Bears 2010, 2011, 2012, 2014, 2015, 2016 | 12 | 6 | 66.67% | 1 | 1193 |
| 6th | Walter Murray Marauders 2012, 2013, 2015, 2017, 2019 | 10 | 5 | 66.67% | 1 | 1012 |
| 7th | North Battleford Composite Vikings 2010, 2012, 2013, 2014, 2015, 2017, 2018, 2019 | 7 | 17 | 29.17% | 1 | 1352 |
| 8th | Marion Graham Falcons 2013, 2018, 2019 | 6 | 3 | 66.67% | 1 | 647 |
| 9th | Tommy Douglas Tigers 2010, 2011, 2013, 2014, 2016, 2017 | 5 | 13 | 27.78% | 0 | 927 |
| 10th | Evan Hardy Souls 2016, 2017, 2018, 2019 | 5 | 7 | 41.67% | 0 | 775 |
| 11th | Legacy Christian Academy 2014, 2015, 2016 | 5 | 4 | 55.56% | 0 | 607 |
| 12th | Christian Centre Academy 2011, 2012 | 3 | 3 | 50% | 0 | 302 |
| 13th |  Regina Sheldon Williams Regina Sheldon Williams2018, 2019 | 2 | 4 | 33.33% | 0 | 332 |
| 14th | Bedford Road Redmen 2010, 2011 | 1 | 5 | 16.67% | 0 | 323 |
| 15th |  Moose Jaw A.E. Peacock Moose Jaw A.E. Peacock2018 | 1 | 2 | 33.33% | 0 | 158 |
Tournament Overall Win Percentage
| Place | Player | Win % | Wins | Losses | Championships | Points |
|---|---|---|---|---|---|---|
| 1st | Centennial Chargers 2010, 2011, 2012, 2013, 2014, 2015, 2016, 2017, 2018, 2019 | 73.33% | 22 | 8 | 4 | 2080 |
| 2nd | Aden Bowman Bears 2010, 2011, 2012, 2014, 2015, 2016 | 66.67% | 12 | 6 | 1 | 1193 |
| 3rd | Walter Murray Marauders 2012, 2013, 2015, 2017, 2019 | 66.67% | 10 | 5 | 1 | 1012 |
| 4th | Marion Graham Falcons 2013, 2018, 2019 | 66.67% | 6 | 3 | 1 | 647 |
| 5th | Moose Jaw Central Collegiate 2011, 2012, 2013, 2014, 2015, 2016, 2017 | 57.14% | 12 | 9 | 0 | 1358 |
| 6th | Legacy Christian Academy 2014, 2015, 2016 | 55.56% | 5 | 4 | 0 | 607 |
| 7th | Prince Albert Carlton Crusaders 2010, 2011, 2012, 2013, 2014, 2015, 2016, 2017, 2018, 2019 | 53.33% | 16 | 14 | 2 | 2020 |
| 8th | Christian Centre Academy 2011, 2012 | 50% | 3 | 3 | 0 | 302 |
| 9th | Yorkton Regional Raiders 2010, 2011, 2012, 2013, 2014, 2015, 2016, 2017, 2018, 2019 | 43.33% | 13 | 17 | 0 | 1871 |
| 10th | Evan Hardy Souls 2016, 2017, 2018, 2019 | 41.67% | 5 | 7 | 0 | 775 |
| 11th | Regina Sheldon Williams 2018, 2019 | 33.33% | 2 | 4 | 0 | 332 |
| 12th | Moose Jaw A.E. Peacock 2018 | 33.33% | 1 | 2 | 0 | 158 |
| 13th | North Battleford Composite Vikings 2010, 2012, 2013, 2014, 2015, 2017, 2018, 2019 | 29.17% | 7 | 17 | 1 | 1352 |
| 14th | Tommy Douglas Tigers 2010, 2011, 2013, 2014, 2016, 2017 | 27.78% | 5 | 13 | 0 | 927 |
| 15th | Bedford Road Redmen 2010, 2011 | 16.67% | 1 | 5 | 0 | 323 |
Tournament Overall Points
| Place | Player | Points | Average | Championships | Wins | Losses | Win % |
|---|---|---|---|---|---|---|---|
| 1st | Centennial Chargers 2010, 2011, 2012, 2013, 2014, 2015, 2016, 2017, 2018, 2019 | 2080 | 69.33 | 4 | 22 | 8 | 73.33% |
| 2nd | Prince Albert Carlton Crusaders 2010, 2011, 2012, 2013, 2014, 2015, 2016, 2017, 2018, 2019 | 2020 | 67.33 | 2 | 16 | 14 | 53.33% |
| 3rd | Yorkton Regional Raiders 2010, 2011, 2012, 2013, 2014, 2015, 2016, 2017, 2018, 2019 | 1871 | 62.37 | 0 | 13 | 17 | 43.33% |
| 4th | Moose Jaw Central Collegiate 2011, 2012, 2013, 2014, 2015, 2016, 2017 | 1358 | 64.67 | 0 | 12 | 9 | 57.14% |
| 5th | North Battleford Composite Vikings 2010, 2012, 2013, 2014, 2015, 2017, 2018, 2019 | 1352 | 56.33 | 1 | 7 | 17 | 29.17% |
| 6th | Aden Bowman Bears 2010, 2011, 2012, 2014, 2015, 2016 | 1193 | 66.28 | 1 | 12 | 6 | 66.67% |
| 7th | Walter Murray Marauders 2012, 2013, 2015, 2017, 2019 | 1012 | 67.47 | 1 | 10 | 5 | 66.67% |
| 8th | Tommy Douglas Tigers 2010, 2011, 2013, 2014, 2016, 2017 | 927 | 51.50 | 0 | 5 | 13 | 27.78% |
| 9th | Evan Hardy Souls 2016, 2017, 2018, 2019 | 775 | 64.58 | 0 | 5 | 7 | 41.67% |
| 10th | Marion Graham Falcons 2013, 2018, 2019 | 647 | 71.89 | 1 | 6 | 3 | 66.67% |
| 11th | Legacy Christian Academy 2014, 2015, 2016 | 607 | 67.44 | 0 | 5 | 4 | 55.56% |
| 12th | Regina Sheldon Williams 2018, 2019 | 332 | 55.33 | 0 | 2 | 4 | 33.33% |
| 13th | Bedford Road Redmen 2010, 2011 | 323 | 53.83 | 0 | 1 | 5 | 16.67% |
| 14th | Christian Centre Academy 2011, 2012 | 302 | 50.33 | 0 | 3 | 3 | 50% |
| 15th |  Luther Lions Luther Lions2010 | 163 | 54.33 | 0 | 0 | 3 | 0% |
| 16th | Moose Jaw A.E. Peacock 2018 | 158 | 52.67 | 0 | 1 | 2 | 33.33% |
Our Sponsors